
Accessibility
Tests of the surfaces with the rotational penetrometer (Figure 3 and 4) began one week after the surfaces were formed and continued monthly (Tables 2 and 3). The test was performed at a different location each time so that the variability of the results may be seen in large part to the test being run in different locations. There is an inherent inaccuracy in the test method and a temperature-related fluctuations in the Resin-EWF surface properties present two other contributors to the fluctuation of the penetrometer readings.
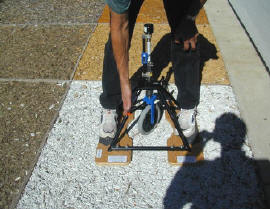
Figure 3. Rotational penetrometer shown in use on surface A2.
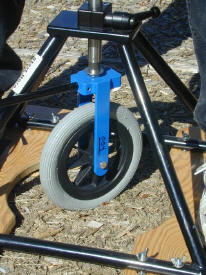
Figure 3. Rotational penetrometer shown in use on surface A2.

Figure 4. After the rotational penetrometer caster wheel is rotated on the surface 360 degrees, the stability reading is taken. In this case, the left photo shows surface A2 indicates poor stability as shown by the amount of silcone-coated EWF displaced by the rotated caster wheel. The right photo shows surface G with little damage from the rotated caster wheel.
Table 2. Rotational Penetrometer measured “firmness” in inches (x25.4 yields mm)
| Surface | 1 week | 1 month | 2 months | 3 months | 4 months | 5 months | 6 months |
| A2 | .38 | .48 | .56 | .39 | .40 | .42 | .39 |
| B | .41 | .38 | .43 | .37 | .37 | .38 | .40 |
| C | .20 | .20 | .20 | .29 | .31 | .18 | .15 |
| D | .25 | .20 | .19 | .40 | .31 | .24 | .17 |
| E2 | .40 | .34 | .36 | .32 | .42 | .41 | .31 |
| F | .40 | .30 | .34 | .40 | .43 | .47 | .38 |
| G | .38 | .33 | .38 | .47 | .34 | .34 | .34 |
| H | .23 | .20 | .19 | .50 | .39 | .32 | .26 |
Table 3. Rotational Penetrometer measured “stability” in inches (x25.4 yields mm)
| Surface | 1 week | 1 month | 2 months | 3 months | 4 months | 5 months | 6 months |
| A2 | .60 | 1.34 | 1.19 | .93 | .98 | .79 | .98 |
| B | .78 | 1.20 | .89 | 1.07 | .84 | .88 | .95 |
| C | .22 | .25 | .23 | .34 | .37 | .26 | .21 |
| D | .30 | .22 | .22 | .40 | .36 | .30 | .23 |
| E2 | .75 | .75 | .71 | .72 | .77 | .79 | .77 |
| F | .44 | .34 | .38 | .48 | .52 | .51 | .42 |
| G | .41 | .41 | .44 | .54 | .48 | .49 | .45 |
| H | .27 | .23 | .23 | .55 | .44 | .36 | .29 |
The classifications of firmness and stability, as categorized by Axelson and Chesney (1999), were used as appropriate for these comparisons during the six months of testing. These rankings were developed after extensive surface testing with full-scale (400 m) test courses. The total mechanical energy expended by 39 human subjects traversing these courses was correlated with the rotational penetrometer device readings to indicate which surfaces presented a physiological challenge to the ambulatory disabled and users of mobility aids. Moderately Firm and Moderately Stable rankings were deemed acceptable for short distances traveled. Play areas would be considered short distances for travel whereas trails and paths would be considered long distances and would require the Firm and Stable rankings.
Firmness is a direct measure of the depression of a surface when a controlled load is placed on it. The categories suggested by Axelson and Chesney (1999) are:
Firm (depresses 7.6 mm [.3”])or less,
Moderately Firm (depresses more than 7.6mm [.3”] less than 12.7 mm [.5”]), and
Not Firm (depresses 12.7mm [.5”] or more).
In only one instance, there was a surface rated as Not Firm. For one reading in May the A2 surface (a silicone binder) became Not Firm. Most of the polyurethane readings from surfaces C, D,and H, yield ratings of Firm. During the heat, and dryness, of summer, the polyurethanes as a class, moved into the Moderately Firm ranking and then by Fall, all three polyurethanes moved back to Firm at the end of testing. All other surfaces, including the EWF consistently were rated as Moderately Firm.
Stability is a measure that includes the simulated wheelchair caster’s depression of the surface and its ability to resist further erosion/indentation due to four 90-degree rotational movements of the simulated wheelchair caster. Axelson and Chesney suggested Stability rankings similar to the way firmness was ranked:
Stable (indents/erodes surface 12.7mm[.5”] or less),
Moderately Stable (indents/erodes surface more than 12.7 mm and up to 25.4mm)
Not Stable (indents/erodes surface more than 25.4mm [1.0”]).
In the six months of testing, the stability of the A2 and B Silicone surfaces could be ranked as Moderately Stable or even Not Stable on numerous occasions while the other treatments were typically rated as Stable (see Figure 4). The unstabilized EWF surface (E2) was consistently Moderately Stable. There were several isolated instances when the latex and non-foaming polyurethane fell into that Moderately Stable ranking. In the summary, the polyurethane systems were rated as Stable in nearly all tests and conditions. The latex systems performed much better than the silicone and the control surface EWF. Most noteworthy is that the silicones became Unstable within the first month and did not improve. We could visually observe the silicone-coated wood elements in the silicone systems coming apart in the first month of the test. The silicone was not able to bond the wood fiber in a matrix after the EWF became wet. Within two months the entirety of surfaces A2 and B became loose (unbound) surfaces with the top layer being composed of silicone-coated wood fiber.
Impact Annenuation
On September 24, 2002, a sunny day with a temperature of 15C, Doug Zeager and Ted Illjes from Zeager Brothers, Inc. came to FPL and performed the ASTM F-1292 testing on the eight experimental exterior surfaces. A tripod was erected to center the impactor over each surface (Figure 5). The results are summarized in Table 4.
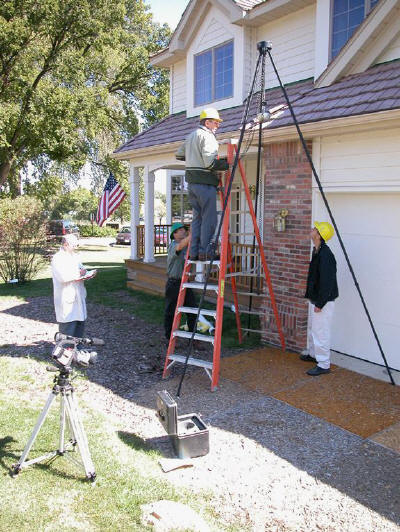
Figure 5. A 4.5 kg (10 lb.) hemispherical impact head is shown installed over the D surface at a height of 3 meters (10 feet). The handheld instrumentation package is being held by Ted Illjes on the ladder and is connected to the impactor via the coiled wire. Doug Zeager awaits the impactor’s arrival and will catch it on its first rebound from the surface.
Table 4. Surface Impact Testing Results per ASTM F 1292:\
Phase I surfaces (unaged) and Phase II (exposed for 6 months)
| Surface/Test | Drop 2 G | Drop3G | Drop2 HIC | Drop 3 HIC | ||||
| Phase I | Phase II | Phase I | Phase II | Phase I | Phase II | Phase I | Phase II | |
| A2 | 52 | 72 | 57 | 71 | 244 | 275 | 272 | 265 |
| B | 53 | 81 | 62 | 79 | 213 | 308 | 251 | 320 |
| C | 67 | 139 | 62 | 130 | 332 | 825 | 315 | 740 |
| D | 68 | 109 | 63 | 109 | 350 | 564 | 357 | 541 |
| E2 | 68 | 83 | 76 | 81 | 274 | 285 | 307 | 306 |
| F | 55 | 85 | 54 | 90 | 236 | 339 | 248 | 387 |
| G | 56 | 83 | 60 | 87 | 312 | 313 | 324 | 318 |
| H | 65 | 103 | 69 | 101 | 325 | 493 | 406 | 472 |
The specification calls for a maximum deceleration G of 200. Considering the mode of falls on playgrounds, the maximum G was chosen for the playground application to balance the cost of the cushioning surface with the expectation for injury from falls. As a relative comparison it is useful to note that the standard test for motorcycle helmets requires the helmet to bring an instrumented headform to rest from 4.7- 5.6 m/s (11-13 miles per hour) without exceeding 400
G. We note that all the surfaces pass the existing specifications for impact attenuation of playground surfaces. The significant observation is that all the polyurethanes exhibited higher G values overall, in comparison to EWF, silicone and latex stabilized EWF. Only the polyurethanes exceeded 100, but none exceeded 140.
A similar observation can be made for the HIC. All the surfaces passed the existing HIC specifications, as it is not to exceed 1000. The HIC value of 1000 is generally presumed to correlate with the impact dynamics required to cause a brain concussion. Again, as a group, the polyurethanes, foaming and non-foaming had the highest HIC of all the surfaces tested. The minimum value was 472 and the highest reached 825. All the other surfaces ranged from 265 to 387. It is presumed that the HIC of 825 will result in a much higher percentage of fall injuries than will a surface with an HIC of 400.
A significant difference in behavior (Tukey tests, α=.10) differentiates the polyurethanes from the latex and silicone surfaces. The silicone, latex, and unstabilized EWF have statistically indistinguishable impact performance. We are able to state with confidence that the 6 months of aging have negatively changed the impact performance significantly for all systems except the unsurfaced EWF.
Moisture and Durability
Due to the in-situ nature of this testing and the size of the test surfaces, we did not have a means for non-destructively evaluating moisture or durability in these surfacing systems. Thus, the visual evaluation of the surfaces was relied upon during the 6 months and MC samples were removed after the test period (Figure 6 and 7). A summary of the surface layer density and moisture content and the EWF moisture content just under the surface layer is given in Table 5 and Figure 8.
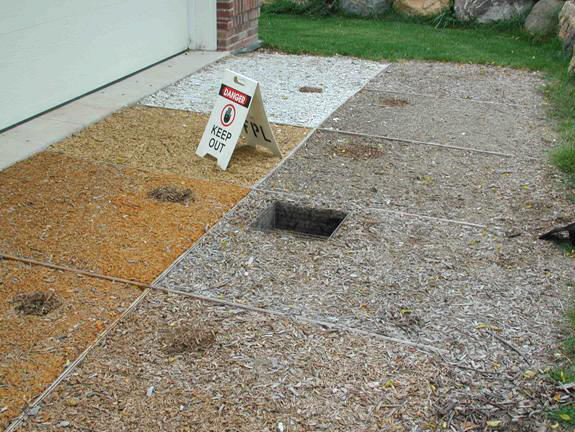
Figure 6. Each tested surface had a small portion removed following the impact test to determine density and moisture content of the layer and the EWF beneath the surface.
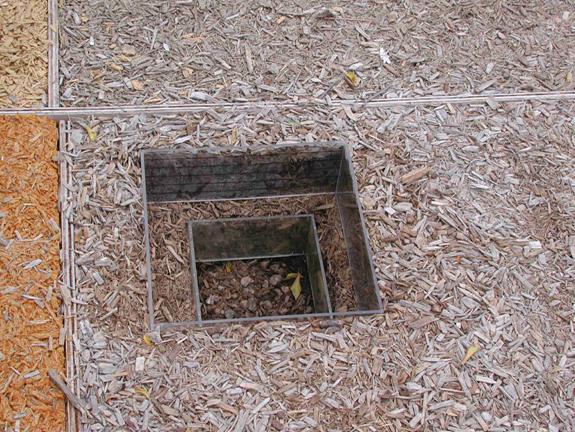
Figure 7. A close-up view of the archeological-type excavation done to determine the moisture profile of the E2 surface. Note the gravel is shown at the bottom of the .3m (12”) excavation.
Figure 8. A comparison of the average moisture content of the stabilized surface layers with the moisture content immediately below that surface.
Table 5. Surface layer specific gravity and moisture content of EWF under surface
| Surface | Surface layer dry specific gravity | Average moisture content of surface layer (%) | Moisture Content (%) under surface layer |
| A2 | .265 | 22 | 131 |
| B | .293 | 48 | 123 |
| C | .438 | 45 | 160 |
| D | .416 | 35 | 132 |
| E2 | .206 (Top 25 mm) | 24 (Top 12 mm) | 76 (sampled at 25mm) |
| F | .179 | 31 | 156 |
| G | .149 | 18 | 82 |
| H | .514 | 33 | 134 |
Moisture content measurements indicate that the bonded surface layers, on average, are not as wet (by weight) as the E2 surface (unstabilized EWF). This measurement is misleading due to the binder’s non-hygroscopic properties. However, the EWF under the stabilized surfaces would appear to be much wetter. This would lead one to presume that the binder/EWF surface layer is retarding the drying process. This in turn causes the underlying EWF to be saturated. Another representation of the moisture in the EWF is shown from the data of Table 6 and illustrated in the moisture content profile of Figure 9. The trendline fitted to the data of the moisture profile in E2 indicates that it is saturated at a depth of approximately 100 mm (4”) and continues to be saturated to the drainage bed. This is an area where additional study would yield some knowledge of the rate of decay under these very wet/saturated conditions. We have no quantified model for predicting the loss (decay) of woody material under these moisture conditions. We could easily presume development of a Resin-EWF System with reduced MC in the unbound EWF would result in a beneficial reduction of decay rates. This in-turn would then extend the life of EWF in-situ for playground surfaces.
Figure 9. Profile of moisture content through the EWF of surface E2 and a trendline fitted through the measurements.
Table 6. Moisture profile data for EWF and layer surfaces
| Surface E | Z-depth (mm) | Wet Wt. (g) | Dry Wt. (g) | MC (%) |
| E0 | 12 | 26.3 | 21.22 | 24 |
| E1 | 25 | 23.8 | 13.5 | 76 |
| E2 | 50 | 24.7 | 11.3 | 119 |
| E3 | 75 | 25.8 | 10.7 | 141 |
| E6 | 150 | 23.6 | 9.5 | 148 |
| E9 | 225 | 25.9 | 10.4 | 149 |
| E12 | 300 | 24.5 | 9.6 | 155 |
| Surface Layer | Wet Wt. (g) | Dry Wt (g) | Area (cm2) | Depth (cm) | Volume (cm3) | Dry SG | MC (%) |
| A | 253 | 207.5 | 156.3 | 5 | 782 | 0.265 | 22 |
| B | 339.7 | 229.3 | 156.3 | 5 | 782 | 0.293 | 48 |
| C | 367.8 | 253 | 156.3 | 3.7 | 578 | 0.438 | 45 |
| D | 219.3 | 162.6 | 156.3 | 2.5 | 391 | 0.416 | 35 |
| F | 227.4 | 173.7 | 156.3 | 6.2 | 969 | 0.179 | 31 |
| G | 170.9 | 144.6 | 156.3 | 6.2 | 969 | 0.149 | 18 |
| H | 394.2 | 297.1 | 156.3 | 3.7 | 578 | 0.514 | 33 |