
Analysis of Low Wheelchair Seat Heights and Transfer Surfaces for Medical Diagnostic Equipment
Final Report
- Prepared by:
- Clive D’Souza, PhD
- Department of Rehabilitation Science and Technology
- University of Pittsburgh
- 6425 Penn Ave, Suite 401, Pittsburgh, PA 15206
- Email: crd85@pitt.edu
- Submitted to:
- David Yanchulis
- Director, Office of Technical and Information Services
- U.S. Access Board
- Phone: (202) 272-0026 (v), (202) 272-0027 (TTY)\
- Email: yanchulis@access-board.gov
January 28, 2022
Summary
This report summarizes a secondary analysis of occupied seat heights for wheelchairs in the US based on data from the Anthropometry of Wheeled Mobility (AWM) project at the University of Buffalo Center for Inclusive Design and Environmental Access (IDeA Center). The analysis described in this report was conducted to address a specific information need expressed by the US Access Board in its deliberations about transfer height provisions in the Accessibility Standards for Medical Diagnostic Equipment (MDE). Data on occupied seat heights for manual and powered wheelchair users (N = 466 of 500 users in the AWM database) were statistically resampled to create virtual samples that were proportionally representative of the total population of wheelchair users in the US in terms of device type (manual vs. powered), gender (men vs. women) and age category (younger 18-64 vs. older 65+). The proportions were obtained from the 1994-97 the National Health Interview Survey on Disability (NHIS-D) study findings presented by LaPlante and Kaye (2010).
The proportion of wheelchair users in the demographically representative samples with a seat height equal to or less than 17 in, 18 in., and 19 in. were 4.5%, 21%, and 42%, respectively. These would be the proportion of wheelchair users excluded if the lower height limit for adjustable transfer surfaces were set at 17 in., 18 in., or 19in. respectively. This report provides information on the analysis background and objective, methodology and findings, along with an application example of the statistical resampling methodology to developing anthropometric design specifications under different scenarios of population demographics. The methodology described can assist policymakers and design practitioners who use anthropometry data of multiple subgroups to develop new design limits and/or specifications and to estimate the influence of changing population demographics on design specifications.
Background
The occupied seat height of wheeled mobility devices is important for determining the necessary height ranges for adjustable height ranges for transfer surfaces of MDE. Generally, maintaining a transfer surface at the same height as the wheelchair seat reduces the effort needed to transfer since the occupant would not have to lift their body weight to make up the difference between the two surface heights, in one direction or the other. The large diversity among wheelchair users and devices implies that a considerable range of height adjustability in transfer surfaces would be needed to provide equivalent transfer heights for nearly all wheeled mobility users.
In 2010, the University of Buffalo’s IDeA Center completed a research study on the anthropometry of 500 wheeled mobility device users in the US. A prior report on occupied seat heights from the AWM project recommended a range of height adjustability between 17 in. and 25 in. for adjustable height transfer surfaces (D’Souza and Steinfeld, 2011). The lower height limit of 17 in. would have excluded 6% of manual wheelchairs in the AWM database. Raising the lower height, such as to 18 in. or 19 in., would understandably have excluded a greater proportion of manual as well as powered wheelchair users (D’Souza and Steinfeld, 2011).
A limitation of the prior analysis was that the AWM study sample was not proportionally representative of the US population of wheeled mobility users in terms of device type (manual and powered wheelchairs, and scooters), age and gender. An important reason for deliberately avoiding a demographically representative sampling approach was to include more users of powered wheelchairs and scooters in the sample anticipating the high anthropometric variability in these sub-groups and the growing use of powered mobility devices compared to manual wheelchairs in coming years (Steinfeld et al. 2010).
The objective of the present analysis on occupied seat heights was to use a statistical resampling (i.e., bootstrapping) approach on demographic data from the AWM project database to generate “virtual” samples that are demographically representative of the total population of wheelchair users in the US as estimated from previous studies (LaPlante and Kaye, 2010). Occupied seat heights for the proportionally representative virtual samples were then used to assess the proportion of manual and power wheelchair users with seat heights at or below 17 in., 18in. and 19 in. to estimate how many wheelchair users would be included vs. excluded if the lower height limit of MDE transfer surfaces were set to any one of these values, respectively. Our analysis used demographic proportions presented by LaPlante and Kaye (2010) from the 1994-97 NHIS-D survey since that was the only recent study providing national estimates of manual wheelchair, powered wheelchair and scooter users separately. In addition, our analysis relied on de-identified demographic information on each individual in the AWM database, implying that information such as age and gender were used but no personal identifiable information (e.g., name, address) was used or needed.
Methodology
Statistical analysis was conducted using the statistical programming language R. The analysis consisted of the following steps:
- Data on occupied seat height from the AWM database were computed for all manual and powered wheelchairs (N = 466, i.e., excluding the 36 scooter users in the AWM database), along with demographic information on gender (men vs. women) and age. The age variable was categorized into a binary variable, namely, “younger” (18-64) and “older” (65+). Summary statistics were computed on this original (unweighted) sample stratified into 8 subgroups, namely, by device type (manual vs. powered), gender (men vs. women), and age (younger vs. older).
- Custom analysis scripts were developed for the purposes of statistical resampling. In addition to the data on occupied seat heights and demographic variables, the resampling algorithm required specifying three additional inputs, namely, a total size for the virtual sample (e.g., N = 500 in this analysis), the proportions or weights for the ‘k’ subgroups in the new sample (k = 8 subgroups in this analysis with proportions specified in Table 1B), and the number of iterations or virtual samples to be generated (e.g., 100 proportionally representative samples). Cases from each subgroup were selected randomly with replacement. An important assumption of the statistical resampling technique is that each subgroup in the AWM database is representative in anthropometry of the underlying subgroup population nationally. Specific to the present analysis, the algorithm generated 100 samples, each of size 500 and proportionally representative or weighted to NHIS-D 1994-97 proportions (Table 1B).
- Percentiles were computed for the 100 virtual samples and then averaged to obtain the best estimate of the true percentile. Percentiles were plotted graphically for the overall sample as well as separately for manual and powered wheelchair users for comparison.
- Average percentiles for the proportionally representative samples were then used to obtain the proportion of wheelchair users that have an occupied seat height equal to or lower than 17 in., 18 in., and 19 in., respectively.
- Lastly, the above steps were repeated for two additional analyses representing hypothetical scenarios with subgroup proportions in Tables 1C and 1D, namely, a +10% and +20% increase in power wheelchair use equally across men/women and young/old relative to the original 1994-97 NHIS-D proportions in Table 1B.
Table 1: Sample proportions (%) by subgroup in (1A) the original AWM project database versus (1B) the resampling analysis using proportions estimated by LaPlante and Kaye (2010). Tables 1C and 1D provide sample proportions for two hypothetical scenarios representing 10% (C) and 20% (D) increases in powered wheelchair prevalence compared to the estimates by LaPlante and Kaye (2010).
1A: Original AWM Project Sample Proportions (%)
| Age | Gender | Manual | Powered | Total |
|---|---|---|---|---|
| 18-64 | Men | 23.0 | 16.7 | 39.7 |
| 18-64 | Women | 13.3 | 12.4 | 25.8 |
| 65+ | Men | 8.6 | 4.7 | 13.3 |
| 65+ | Women | 14.6 | 6.7 | 21.2 |
| 59.4 (Total %) | 40.6 (Total %) | 100.0 |
1B: Resampled Proportions as per the 1994-97 NHIS-D (LaPlante and Kaye, 2010)
| Age | Gender | Manual | Powered | Total |
|---|---|---|---|---|
| 18-64 | Men | 17.6 | 2.8 | 20.5 |
| 18-64 | Women | 18.6 | 3.0 | 21.6 |
| 65+ | Men | 18.8 | 1.0 | 19.8 |
| 65+ | Women | 36.1 | 2.0 | 38.1 |
| 91.1 (total %) | 8.8 (total %) | 100.0 |
1C: 1B with a 10% increase in Powered wheelchair prevalence
| Age | Gender | Manual | Powered | Total |
|---|---|---|---|---|
| 18-64 | Men | 15.1 | 5.3 | 20.5 |
| 18-64 | Women 16.1 | 5.5 | 21.6 | |
| 65+ | Men | 16.3 | 3.5 19.8 | |
| 65+ | Women | 33.6 | 4.5 | 38.1 |
| 81.1 (total %) | 18.8 (total %) | 100.0 |
1D: 1B with a 20% increase in Powered wheelchair prevalence
| Age | Gender | Manual | Powered | Total |
|---|---|---|---|---|
| 18-64 | Men | 12.6 | 7.8 | 20.5 |
| 18-64 | Women | 13.6 | 8.0 | 21.6 |
| 65+ | Men | 13.8 | 6.0 | 19.8 |
| 65+ | Women | 31.1 | 7.0 | 38.1 |
| 71.1 {Total %} | 28.8 {Total %} | 100.0 |
Results
1. Summary statistics
Summary statistics on the original (unweighted) data for occupied seat height are not directly relevant for resampling, but they indicate key trends and differences in the underlying data. Also, the prior analysis by D’Souza and Steinfeld (2011) did not consider age categories and hence are presented here for reference. Notably, Figure 1 and Table 2 indicate that occupied seat height varied across wheelchair type, gender and age categories. Median seat heights for older men and women using manual wheelchairs were lower than their counterparts that used powered wheelchairs. Median seat heights for manual wheelchairs used by younger women were lower than seat heights for younger men. Lastly, seat heights of powered wheelchairs also had larger variability (i.e., longer tails in Figure 1) compared to manual wheelchairs.
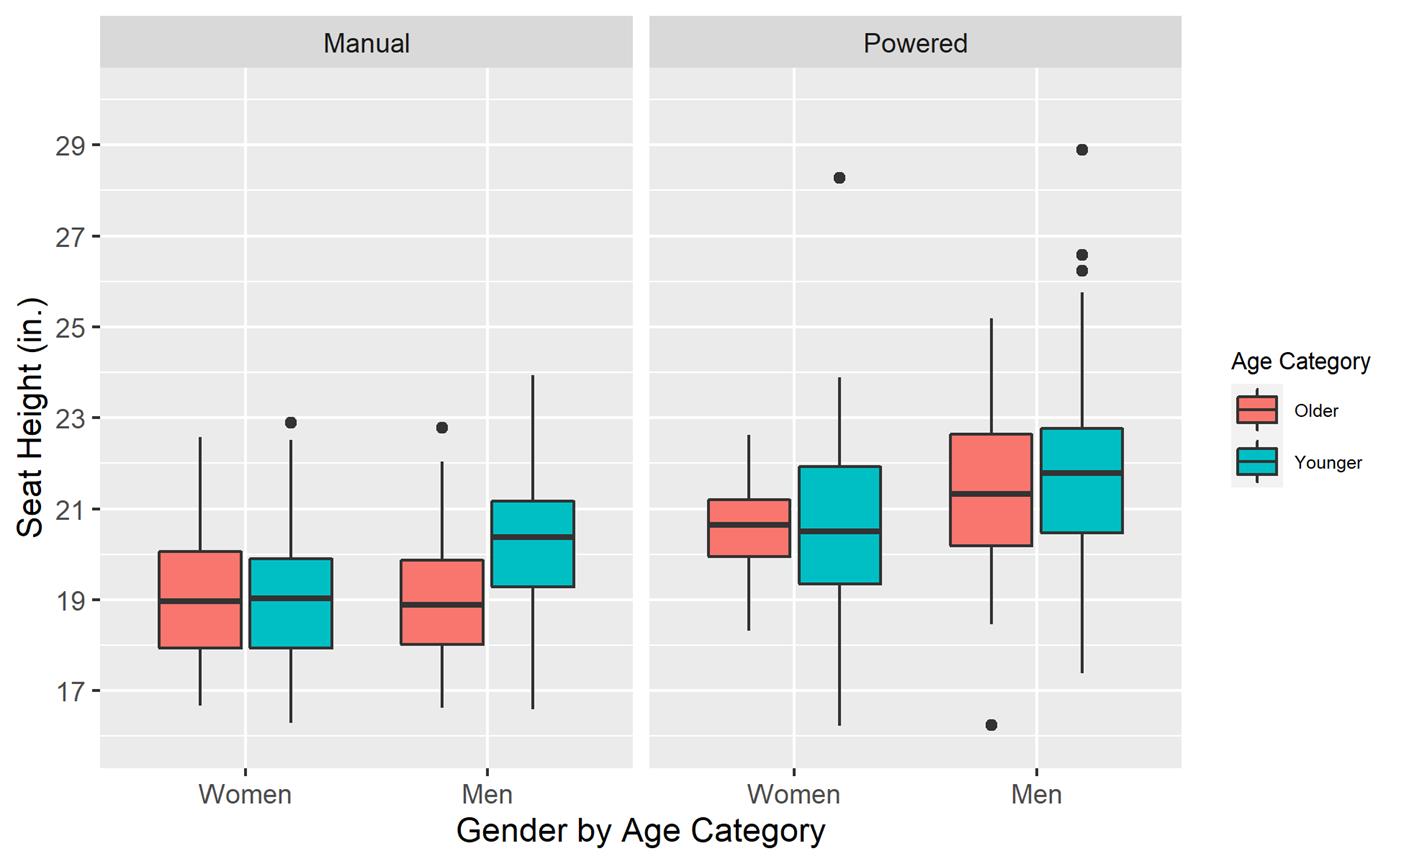
Figure 1: Boxplot for the original unweighted occupied seat height (inches) depicting the median (represented by a thick black horizontal line), interquartile range (25th to 75th percentile indicated by box length), and minimum and maximum values (whiskers) stratified by device type (manual vs. powered), gender (men vs. women), and age category (older vs. younger). Statistical outliers indicated by dots are values that exceed 1.5 times the box length.
Table 2: Summary statistics for occupied seat height (inches) computed on the original unweighted AWM sample for eight subgroups, i.e., stratified by wheelchair type (manual vs. powered), gender (women vs. men) and age category (younger vs. older).
| Manual Wheelchair Users | Powered Wheelchair Users | |||||||
|---|---|---|---|---|---|---|---|---|
| Group | N | Mean (SD) | Median (IQR) | Min – Max | N | Mean (SD) | Median (IQR) | Min – Max |
| Women-Younger | 62 | 19.1 (1.5) | 19.0 (2.0) | 16.3 – 22.9 | 58 | 20.6 (2.0) | 20.5 (2.7) | 16.2 – 28.3 |
| Women-Older | 68 | 19.1 (1.4) | 19.0 (2.2) | 16.7 – 22.6 | 31 | 20.5 (1.2) | 20.6 (1.5) | 18.3 – 22.6 |
| Men-Younger | 107 | 20.2 (1.5) | 20.4 (1.9) | 16.6 – 23.9 | 78 | 21.9 (2.0) | 21.8 (2.3) | 17.4 – 28.9 |
| Men-Older | 40 | 19.1 (1.4) | 18.9 (1.9) | 16.6 – 22.8 | 22 | 21.3 (2.0) | 21.3 (2.4) | 16.2 – 25.2 |
| Combined | 277 | 19.5 (1.5) | 19.4 (2.3) | 16.3 – 23.9 | 189 | 21.2 (2.0) | 21.2 (2.5) | 16.2 – 28.9 |
2. Resampled Data Percentiles by Seat Height
The key outcome from the resampling analysis is that the percentiles for the combined proportional sample are similar to the percentiles for manual wheelchairs alone. This is show in Figure 2 in the form of a cumulative percentile plot for the proportionally representative or weighted sample of wheelchair users indicated by the solid black line computed from the average distribution of all 100 virtual samples. Figure 2 also depicts separate plots for the weighted sample of manual and powered wheelchair users separately for comparison purposes. The percentiles for the combined weighted sample closely followed the percentiles for manual wheelchair users given the high proportion (91.1%) for the latter in the original 1994-97 NHIS-D proportions in Table 1B. For the combined weighted sample, a seat height of 17 in. corresponded to the 4.5 percentile. Likewise, a seat height of 18 in. and 19 in. corresponded to the 21st and 42nd percentile in the combined weighted sample, respectively. These would be the estimated proportion of wheelchair users excluded if the lower height limit of MDE transfer surfaces were set to 17 in., 18 in., or 19 in. respectively, with the vast majority of those excluded being users of manual wheelchairs.
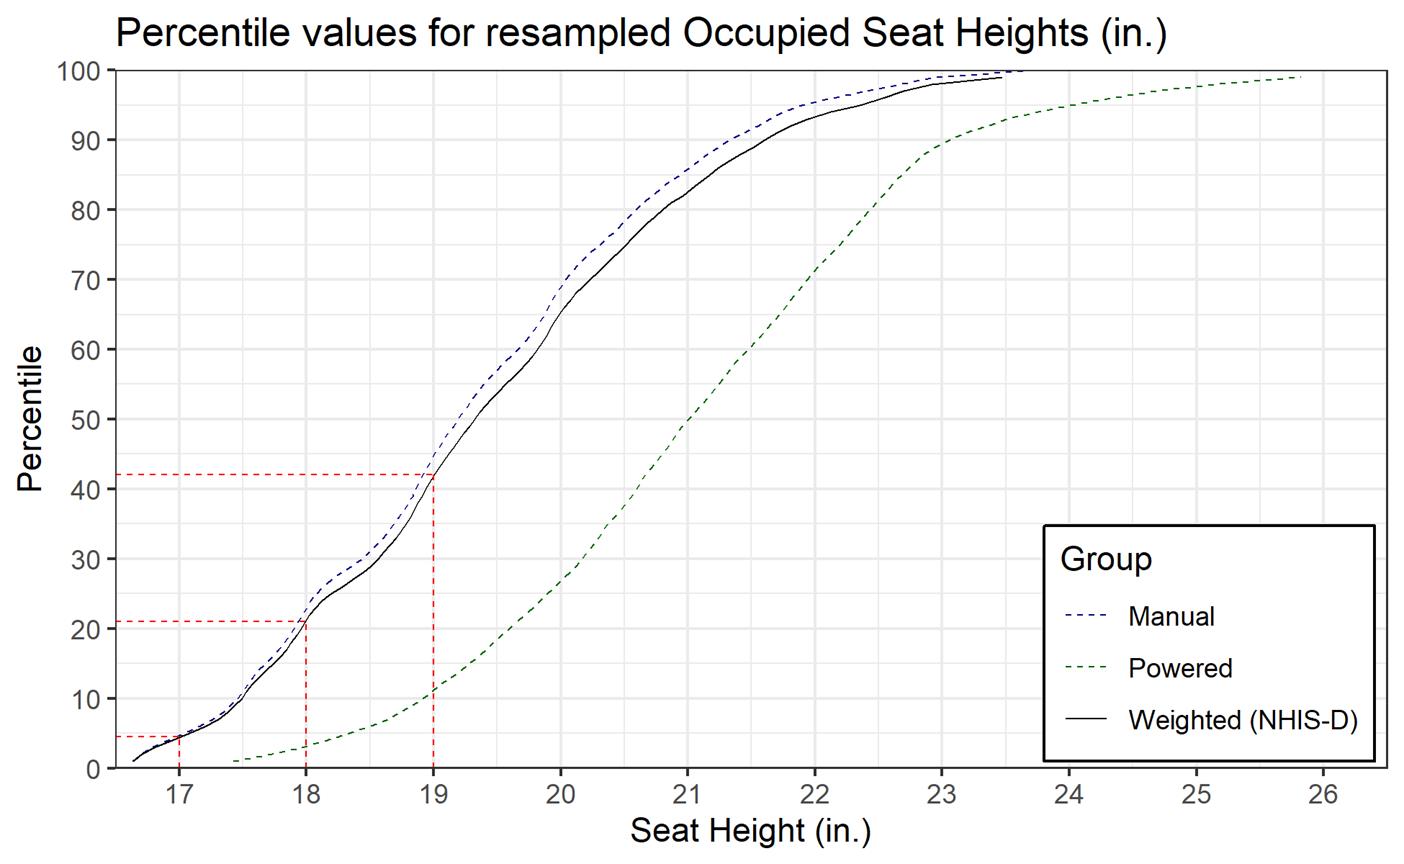
Figure 2: Cumulative percentile plot of occupied seat height (inches) after statistical resampling for a proportionally representative population of wheeled mobility users in terms of age (18-64, 65+), gender (men, women) and device type (manual and powered wheelchairs) indicated by a solid black line, and separately for manual (blue dashed line) and powered (green dashed line) wheelchair users. The cumulative percentile plot for the combined sample (black) generally tracks the plot for manual wheelchair users (blue) given their larger proportion compared to powered wheelchair users (91.1% vs. 8.8%), as per the NHIS-D 1994-97 survey. Percentage of the combined sample with an occupied seat heights less than or equal to 17in., 18in. and 19in. are 4.5%, 21%, and 42%, respectively.
3. Potential Influence of Increased Powered Wheelchair Use
The original AWM project had deliberately included more users of powered wheelchairs and scooters in the sample in lieu of a proportional sampling approach anticipating the high anthropometric variability in these sub-groups and the growing use of powered mobility devices compared to manual wheelchairs in coming years. To explore the influence of increasing prevalence of powered wheelchairs since the time of the 1994-97 NHIS-D study, our analysis explored two hypothetical scenarios represented in Tables 1C and 1D by increasing the proportions or weights assigned to powered wheelchairs vs. manual wheelchairs. Figure 3 provides cumulative percentile plots depicting the influence of increasing the proportion of powered wheelchair users in the overall sample by +10% and +20% relative to the original 1994-97 NHIS-D study proportions. Not surprisingly, the net effect on the combined percentiles is a gradual shift away from the cumulative percentile plot for manual wheelchairs (i.e., due to their decreasing influence) towards to trend line for powered wheelchairs. In relation to a specific value of seat height, for instance 19 in., the increasing proportion of powered wheelchair users caused the percentiles for the combined weighted sample to decrease, from 42% in the original proportion of 8.8% to the 39th percentile for a +10% increase and the 36th percentile for a +20% increase in powered wheelchair use. These percentiles would be the estimated proportion of wheelchair users excluded if the lower height limit of MDE transfer surfaces were set to 19 in. and the proportion of powered wheelchair users in the population were to increase relative to the 1994-97 NHIS-D proportions. It should be noted that increasing the proportion of powered wheelchairs in the population has less influence on the percent accommodated at the very low end (e.g., <17.5 in) and very high end (e.g., >24 in.) of the seat height distribution where the different trend lines converge noticeably.
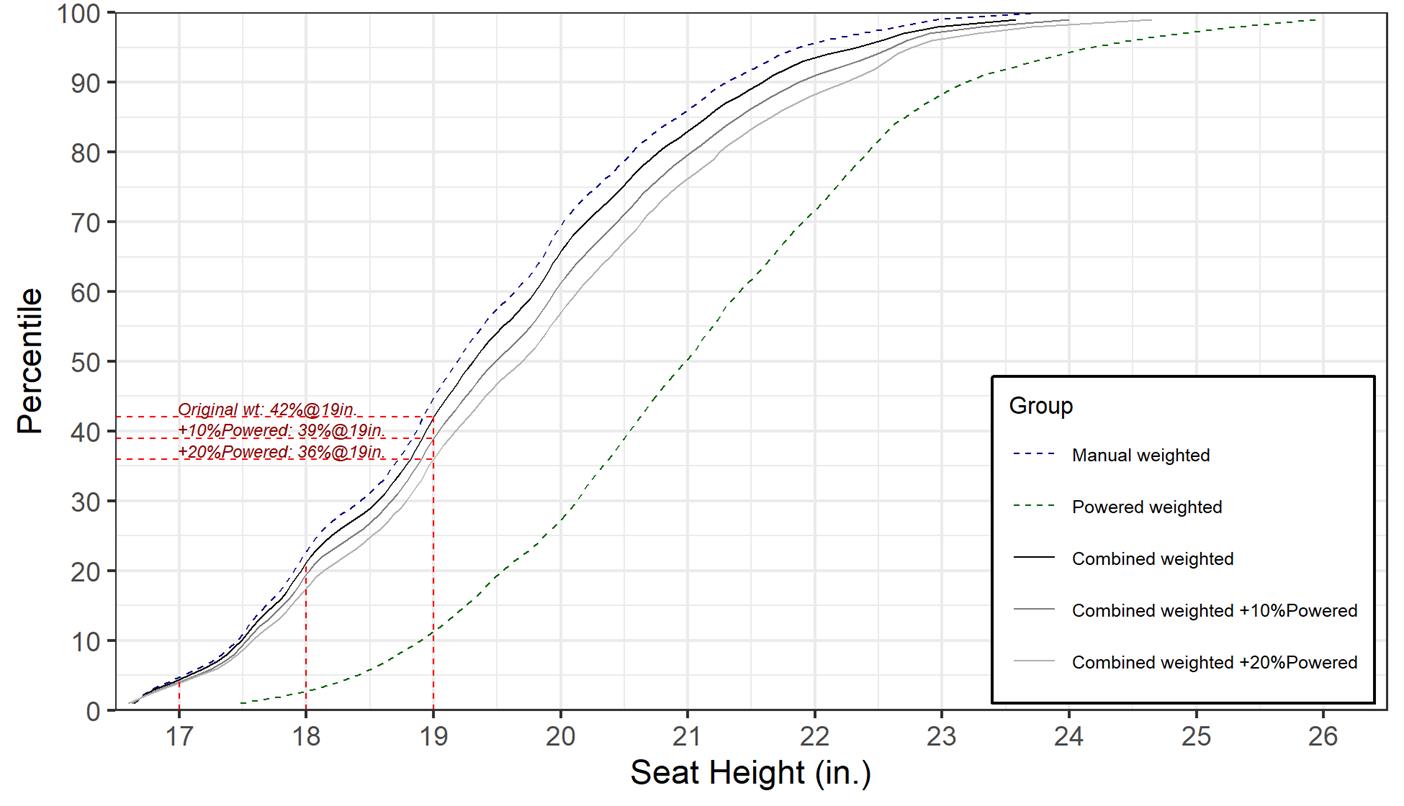
Figure 3: Cumulative percentile plot of occupied seat height (inches) after statistical resampling for a proportionally representative population of wheeled mobility users in terms of age (18-64, 65+), gender (men, women) and device type (manual and powered wheelchairs) indicated by a solid black line, and separately for manual (blue dashed line) and powered (green dashed line) wheelchair users. The two solid grey lines depict the cumulative percentile plots for hypothetical scenarios with an increasing proportion of powered wheelchair users (i.e., decreasing proportion of manual wheelchair users), namely, a +10% and +20% increase in power wheelchair use equally across men/women and young/old relative to the original 8.8% in the NHIS-D 1994-97 survey. The greater the proportion of powered wheelchair users, the combined percentile plot shifts closer towards the plot for powered wheelchair users (green dotted) and the combined percentile decreases as indicated for the example seat height of 19in.
Conclusion
This report summarizes our analysis of using a statistical resampling approach to generating virtual samples of wheelchair users from the AWM database that were demographically representative of the total population of wheelchair users in the US in terms of device type, gender and age category as estimated from the 1994-97 NHIS-D study (LaPlante and Kaye, 2010). Occupied seat heights for the demographically representative virtual samples were used to assess the proportion of manual and power wheelchair users with seat heights at or below 17 in., 18 in., and 19 in., resulting in percentages of 4.5%, 21%, and 42%. These would be the estimated proportion of wheelchair users excluded if the lower height limit of MDE transfer surfaces were set to 17 in., 18in. or 19 in., respectively.
Due the high proportion of manual relative to powered wheelchair users estimated in the 1994-97 NHIS-D study, percentiles for the combined proportional sample were similar to the percentiles for manual wheelchairs alone. It is expected that use of powered wheelchairs nationally has increased since the time of the 1994-97 NHIS-D study. The resampling analysis presented in this report provides a method for estimating the potential influence of increasing powered wheelchair proportions on design requirements and/or percent accommodated. Specific to setting the lower height limit for transfer surfaces, our analysis of a hypothetical increase in powered wheelchair proportions indicated that the percent excluded would show a small decrease (i.e., increased accommodation) at intermediate values (e.g., at 19 in., a 10% increase in powered wheelchair proportions decreased the percent excluded from 42% to 39%). However, at lower heights such as 17 in., there is no substantial change in percentiles since most wheelchair users, regardless of device type, are already accommodated (i.e., at 17 in., a 10% increase in powered wheelchair proportions decreased the percent excluded from about 4.5% to 4%). This suggests that setting design specifications closer to the tails of the distribution (e.g., 17 or 17.5 in.) would be less susceptible or more robust to future changes in population demographics.
References
D’Souza, C. and Steinfeld, E. (2011). DR-23: Analysis of seat height for wheeled mobility devices. Center for Inclusive Design and Environmental Access, IDeA Center, University at Buffalo, Buffalo, NY. Retrieved from: http://idea.ap.buffalo.edu/wp-content/uploads/sites/110/2019/08/23.pdf
LaPlante, M. P., & Kaye, H. S. (2010). Demographics and trends in wheeled mobility equipment use and accessibility in the community. Assistive Technology, 22(1), 3-17.
Steinfeld, E., Paquet, V., D’Souza, C., Joseph, C., & Maisel, J. (2010). Anthropometry of wheeled mobility project. Report prepared for the U.S. Access Board. IDeA Center, Buffalo, NY.